
Water Intelligence Event Summary · Issue 005
Hurricane Nolo: Where New Storm Exposure Met Existing Stress
- Issue
- 005
- Geography
- Oʻahu and Hawaiʻi Island, Hawaiʻi
- Event / analysis period
- Event analysis period September 23–30, 2026
- Assessment
- Coastal Hazard and Water-Quality Exposure Assessment
The PDF is the approved executive summary, not the complete report. Request Complete Report to ask for the full Water Intelligence Event Report.
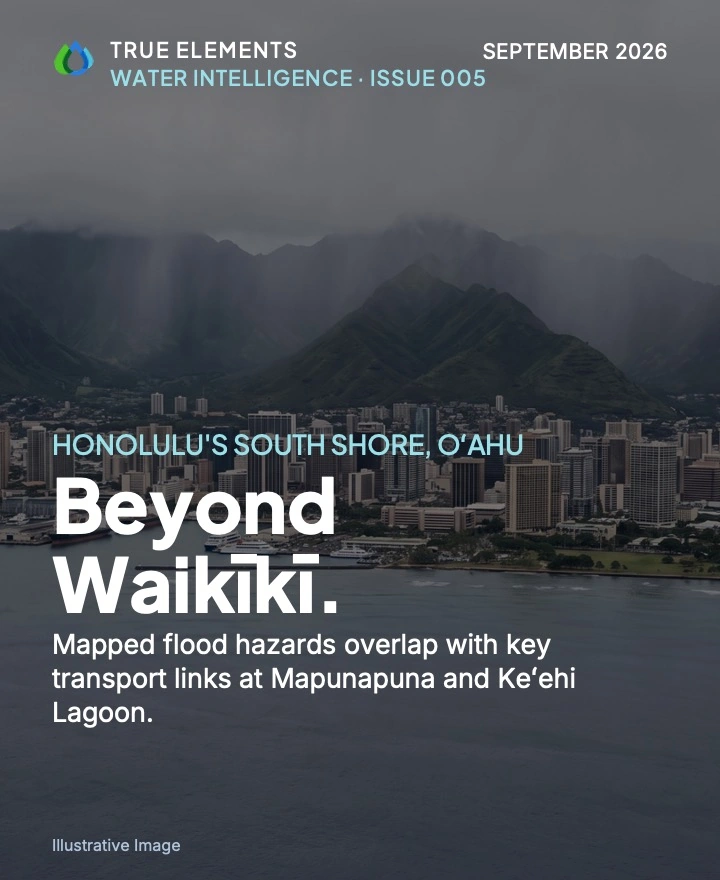
Illustrative artwork. Not a photograph of observed storm impact.
What this investigation examines
Examines how mapped and modeled coastal hazards coincide with infrastructure, impaired waters and community vulnerability across Oʻahu and Hawaiʻi Island during the September 23–30 analysis period. Mapunapuna, Keʻehi Lagoon and Honokōhau Harbor show concentrated exposure. This is not a report of observed flooding, surge, water-quality change or damage; the evidence snapshots cannot be timed against Nolo's passage.
Issue 005 Executive Summary
The PDF cover is labeled “Illustrative Image” (AI-generated editorial visualization based on the documented event). The website image for this issue is not a record of observed storm impact.
Event Summary of the Water Intelligence Event Report for Oʻahu and Hawaiʻi Island, September 23–30, 2026
Concentrated Exposure on Already-Stressed Coasts
The evidence maps where Nolo could matter most. It does not confirm what the storm did.
Hurricane Nolo's significance is concentrated exposure layered on pre-existing stress.
On both islands, mapped and modeled layers for hazard, infrastructure, impaired water and limited recovery capacity coincide in the same low-lying coastal districts. The evidence establishes that exposure; it does not establish damage.
Hurricane Nolo affected Oʻahu and Hawaiʻi Island during the analysis period of September 23–30, 2026. True Elements' TrueQi® Water Intelligence System, supported by Argus™, examined rainfall estimates, flash-flood guidance, regulatory floodplain maps, a modeled storm-surge scenario, impaired-waters listings, modeled water-quality scores and community vulnerability screening for both islands. Argus™ supports the organization and comparison of that evidence. Its outputs are analytical decision support, not certified engineering conclusions.
The evidence concentrates concern in a few places. On Oʻahu, Mapunapuna and Keʻehi Lagoon show the densest overlap of mapped flood hazard, modeled surge exposure and transportation infrastructure in the Honolulu metro area. On Hawaiʻi Island, Honokōhau Harbor carries the highest mapped coastal-hazard concentration. It sits on a single coastal electric transmission corridor that crosses surge- and flood-prone ground.
Evidence note: This is a risk and exposure assessment, not a damage report. The analysis did not assess damage reports, stream or tide gauge readings, observed surge or post-storm water sampling. The dates, times and timezone of the data reads were not recorded, so no reading can be placed before, during or after Nolo's passage.
Nolo's heaviest reported rain and its most exposed coasts are in different places
National Weather Service (NWS) rainfall estimates show rainfall organized by terrain on both islands. On Oʻahu, the Koʻolau Range received about 1.5–2.0 inches, while the southern and western coasts received 0.1–0.5 inches. On Hawaiʻi Island, the interior and the Mauna Kea and Mauna Loa flanks received 3.0–8.0+ inches, compared with 0.1–0.25 inches on the immediate Kona coast.
Evidence note: These are estimates, not gauge observations, and the accumulation period behind the totals was not stated.
Kaʻū is the more runoff-sensitive of the two Hawaiʻi Island study areas. NWS Flash Flood Guidance indicates that flash flooding there generally requires only about 1–3 inches of rain per hour, compared with about 3–5 or more inches per hour on the Kona western slopes. Kaʻū also received higher reported totals, including 3.0–4.0 inches near Pāhala.
Evidence note: Flash Flood Guidance is expressed as rainfall per hour, and the reported estimates are totals over an unstated period. This evidence cannot show whether any threshold was reached. The higher totals near Pāhala are not evidence that flash flooding occurred.
Mapunapuna and Keʻehi Lagoon carry Oʻahu's deepest exposure
This low-lying area recorded the highest coastal flood hazard composite scores in the Honolulu metro area, with 7–10 overlapping hazard zones in some places. It lies partly within the Federal Emergency Management Agency (FEMA)'s 1% annual chance (100-year) floodplain, a regulatory designation of an area with a 1% chance of flooding in any year. It is also the only Oʻahu location reported with modeled Category 1 storm-surge inundation greater than 3 feet. Waikīkī is the most visible district on this coast, but Mapunapuna and Keʻehi Lagoon carry the deeper exposure.
Evidence note: The surge figure comes from a planning scenario for a hypothetical Category 1 hurricane. It does not describe water depths observed during Nolo. The floodplain is a regulatory designation, not event flooding. The hazard composite has no named source, and its scale may not match Hawaiʻi Island's.
Honokōhau Harbor and a single coastal power line
At Honokōhau Harbor, the coastal flood hazard composite shows 8–11 overlapping hazard zones, the highest category in the Hawaiʻi Island analysis. The Category 1 surge scenario shows both less-than-3-foot and greater-than-3-foot inundation zones around the harbor. A primary electric transmission line runs along much of the western and southern coast through storm-surge and flood-prone areas. It passes near the harbor, Kailua-Kona, Kealakekua and Pāhala, among other communities. True Elements infers that damage at one exposed point could create wider power problems.
Evidence note: The corridor's exposure was mapped, but grid redundancy was not assessed. No outage or line damage is established, and potential effects on power supply remain an inference. Because the two islands' composites may not share a scale, Honokōhau's value is not ranked against Oʻahu's.
Many receiving waters were listed as impaired before Nolo, and several exposed districts carry mapped vulnerability
The U.S. Environmental Protection Agency (EPA)'s water-quality assessment database, ATTAINS, lists many of Oʻahu's urban streams and coastal waters as impaired before Nolo. These include Honolulu Harbor, Keʻehi Lagoon, Pearl Harbor shoreline areas, the Ala Wai Canal, Waikīkī coastal segments and the Nuʻuanu, Kalihi and Moanalua streams. ATTAINS also shows widespread impaired coastal waters along the Kona and Kaʻū coastlines. True Elements infers that Nolo's runoff added contamination to these waters.
Evidence note: The specific pollutant behind each listing was not read. No post-storm sampling was assessed, so added loading is a reasoned inference, not a measured increase.
TrueQi® modeled scores show a gradient on Oʻahu. The Honolulu metro drinking-water service area scored 93, compared with 87 for urban and coastal surface waters. The modeled scores are higher for the Honolulu drinking-water service area than for urban and coastal surface waters.
Evidence note: TrueQi® scores are proprietary modeled values, not regulatory measurements. Their read time is unknown, and no post-storm sampling was assessed. The gradient therefore does not show that drinking water was safe or unaffected during Nolo.
EPA's environmental screening tool, EJScreen, places Chinatown, Pālama and Kalihi in the highest percentile range for a combined measure of people of color and low-income residents. Mapunapuna and Salt Lake show moderate-to-high vulnerability. EJScreen also shows elevated linguistic isolation, meaning households in which no one over age 14 speaks English very well, in Waikīkī and parts of Liliha and Kalihi. On Hawaiʻi Island, the Climate and Economic Justice Screening Tool (CEJST) designates disadvantaged communities along the Kona coast from Kailua-Kona through Hōnaunau-Nāpōʻopoʻo, and along the Kaʻū coast, including Pāhala and Nāʻālehu.
Evidence note: These are screening designations of vulnerability and recovery capacity, not measures of storm harm.
Layers that are weak alone point to the same places when combined
Mapped and modeled layers for hazard, infrastructure, impaired water and vulnerability co-locate at five sites: Mapunapuna and Keʻehi Lagoon, Honokōhau Harbor, the Kailua-Kona waterfront, Pearl Harbor-Hickam and the Kaʻū coast. Together, three of these datasets form a coherent pathway: rain fell upslope, modeled quality declines from upland to urban waters, and the receiving waters were already impaired. That pathway indicates that the water-quality question after Nolo concerns surface and coastal receiving waters primarily, rather than treated drinking water.
Evidence note: Co-location indicates concentrated exposure, not independent confirmation, causation or impact. The relationships among the layers are undocumented, and no sampling yet tests the receiving-water reading.
“The places most exposed to Nolo were, in many cases, the places least able to absorb another storm.”
True Elements' analysis describes Nolo as the third hurricane-related event to reach the Hawaiian Islands within roughly two months. True Elements infers that a storm in quick succession meets systems not yet reset. Drainage may still hold debris, culverts and slopes may be weakened, and impaired waters may receive a new pollution pulse before the last has flushed. Households may face repeated cleanup costs and financial strain, especially in disadvantaged communities.
Evidence note: The earlier events are not named, dated or documented, so the sequence is reported, unverified context. The cumulative mechanism is plausible but depends on that sequence and on post-storm conditions that the analysis does not document.
Considerations for qualified agencies and operators, not prescribed actions
The convergence raises the question of whether post-storm inspection has reached the highest-exposure sites. On Oʻahu, these include Mapunapuna, Keʻehi Lagoon, Honolulu Harbor, Pearl Harbor-Hickam, airport access routes and H-1 interchanges. On Hawaiʻi Island, they include Honokōhau Harbor, the Kailua-Kona waterfront and Kaʻū roads and gulches. Because the affected waters were impaired beforehand, a monitoring program confined to drinking water would miss the exposure that the evidence emphasizes. Agencies may consider extending sampling to urban streams, canals, harbors, beaches and reef-adjacent waters. For districts with elevated linguistic isolation, True Elements favors multilingual, visual updates distributed through trusted community channels.
The highest-value next information is observational: inspection results at the convergence sites and surface-water sampling in impaired receiving waters. Either would convert mapped exposure into confirmed condition or rule it out.
Evidence note: These are considerations, not directives. Engineering judgments are outside the report. Open questions include whether Nolo flooded, surged or damaged any of these places, and the exposure of the Waiʻanae Coast, which was not fully assessed.
The complete evidence, sources and limitations. The full Water Intelligence Event Report for Issue 005 documents every data layer, measurement, qualification and source behind this Summary. Use Request Complete Report on this issue to ask for access. The executive summary PDF is not the complete report.
True Elements is a water intelligence company. Its TrueQi® Water Intelligence System, supported by Argus™ Ai, connects trusted public water, weather and hazard data into a traceable operating picture for consequential decisions.
Website: trueelements.com · Start a conversation: trueelements.com/contact
Water Intelligence Event Summary 005 • Hurricane Nolo
This report is a water intelligence analysis prepared by True Elements using the TrueQi® Water Intelligence System and Argus™ AI analytics, applying True Elements' proprietary data integration and interpretation methodology, including subject matter covered by U.S. Patent No. US 12,670,407 B2 and pending patent applications. It synthesizes and interprets publicly available third-party data, including applicable NOAA, National Weather Service, FEMA, USGS, state and local sources, based on the source materials supplied for this report.
This report does not constitute engineering, hydrological, meteorological, legal, financial, insurance or other professional advice, and is not a substitute for such advice. It is not an emergency warning, official flood forecast or regulatory determination, and must not be relied upon as the sole basis for safety, engineering, financial, insurance, legal or emergency-response decisions. Readers should independently verify all conditions through official NOAA, National Weather Service, USGS, state and local emergency-management sources, and should consult a licensed engineer, hydrologist, attorney or other qualified professional before taking any action in reliance on this report.
True Elements makes no representation or warranty, express or implied, as to the accuracy, completeness, timeliness or fitness for any particular purpose of the information contained in this report, including data obtained from third-party sources. Environmental conditions change rapidly and may have changed materially since the source information was collected; collection dates were not supplied for this report. True Elements disclaims all liability for any loss, damage, injury or claim arising from reliance on this report, to the fullest extent permitted by law.
TrueQi® is a registered trademark of True Elements Inc. Argus™ and AgForward™ are trademarks of True Elements Inc. This report and its methodology are proprietary to True Elements and may not be reproduced or redistributed without permission.
Argus™-generated interpretations are analytical outputs of an AI system and are provided for decision-support purposes only; they are not certified engineering conclusions and remain subject to human expert review.
© 2026 True Elements. All rights reserved. Image credit: AI-generated editorial visualization based on the documented event.
Questions about this report
Answers draw only on the executive summary above, and keep its distinctions between observation, mapped exposure, modeled scenarios, inference and unknowns.
What did the Hurricane Nolo investigation establish, and what did it not establish about damage?
It established concentrated exposure: on both islands, mapped and modeled layers for hazard, infrastructure, impaired water and limited recovery capacity coincide in the same low-lying coastal districts. It is a risk and exposure assessment, not a damage report. The analysis did not assess damage reports, stream or tide gauge readings, observed surge or post-storm water sampling, so it does not establish what the storm did.
See the executive summaryWhy are Mapunapuna and Keʻehi Lagoon highlighted in the Oʻahu analysis?
This low-lying area recorded the highest coastal flood hazard composite scores in the Honolulu metro area, with 7–10 overlapping hazard zones in some places. It lies partly within FEMA’s 1% annual chance (100-year) floodplain and is the only Oʻahu location reported with modeled Category 1 storm-surge inundation greater than 3 feet. The surge figure comes from a planning scenario for a hypothetical Category 1 hurricane, not water depths observed during Nolo, and the floodplain is a regulatory designation, not event flooding.
See the executive summaryWhat does the Honokōhau Harbor analysis say about coastal and infrastructure exposure?
At Honokōhau Harbor, the coastal flood hazard composite shows 8–11 overlapping hazard zones, the highest category in the Hawaiʻi Island analysis, and the Category 1 surge scenario shows both less-than-3-foot and greater-than-3-foot inundation zones around the harbor. A primary electric transmission line runs along much of the western and southern coast through storm-surge and flood-prone areas and passes near the harbor. True Elements infers that damage at one exposed point could create wider power problems, but grid redundancy was not assessed and no outage or line damage is established. Because the two islands’ composites may not share a scale, Honokōhau’s value is not ranked against Oʻahu’s.
See the executive summaryHow did estimated upslope rainfall differ from conditions on the exposed coasts, and what timing limits apply?
National Weather Service estimates show rainfall organized by terrain: about 1.5–2.0 inches on Oʻahu’s Koʻolau Range versus 0.1–0.5 inches on the southern and western coasts, and 3.0–8.0+ inches on Hawaiʻi Island’s interior and the Mauna Kea and Mauna Loa flanks versus 0.1–0.25 inches on the immediate Kona coast. These are estimates, not gauge observations, and the accumulation period behind the totals was not stated. The dates, times and timezone of the data reads were not recorded, so no reading can be placed before, during or after Nolo’s passage.
See the executive summaryWhat observations would help confirm or rule out the report’s open questions?
The report identifies the highest-value next information as observational: inspection results at the convergence sites and surface-water sampling in impaired receiving waters. Either would convert mapped exposure into confirmed condition or rule it out. Open questions include whether Nolo flooded, surged or damaged any of these places, and the exposure of the Waiʻanae Coast, which was not fully assessed. These are considerations for qualified agencies and operators, not directives.
See the executive summaryContinue exploring
- Another dated investigation · Issue 004NYC Tri-State Nor’easter Flood and Water-Quality EventA separate, dated investigation of where mapped surge and flood-zone exposure overlaps with polluted waters and contaminated sites across New York City and the Tri-State Region, September 25–28, 2026.
- CollectionThe Water Intelligence SeriesEvery dated investigation, newest first, with executive summaries, summary PDFs and complete-report requests.
- PerspectivesInsightsEssays and analysis on how water shapes business decisions, infrastructure, food systems and communities.
- Related applicationGovernment & Infrastructure Water Intelligence