Water Intelligence Event Summary · Issue 004
NYC Tri-State Nor’easter Flood and Water-Quality Event
- Issue
- 004
- Geography
- New York City and the Tri-State Region of New York, New Jersey and Connecticut
- Event / analysis period
- Event period September 25–28, 2026
- Published
- September 2026
- Assessment
- Compound Flood and Contamination-Risk Assessment
The PDF is the approved executive summary, not the complete report. Request Complete Report to ask for the full Water Intelligence Event Report.
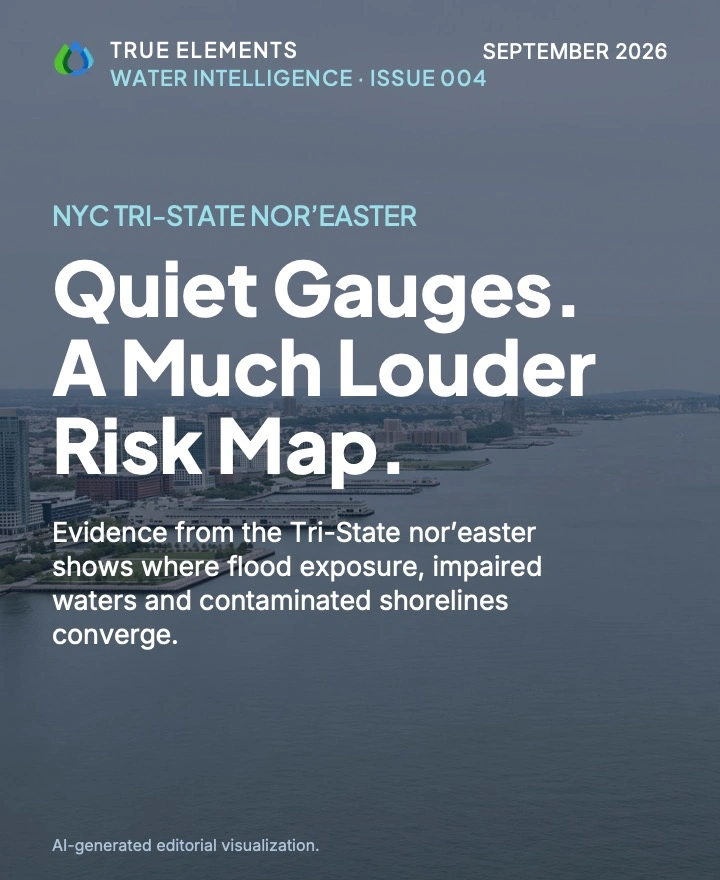
Illustrative artwork. Not a photograph of observed storm impact.
What this investigation examines
Examines 12 public map layers across the New York City and Tri-State region during the September 25–28 nor’easter. Mapped surge and flood-zone exposure overlaps with polluted waters and contaminated sites in several waterfront corridors. The assessment identifies where risks may coincide; it does not document observed flooding or pollution releases, and the observation session could not be compared with the storm peak.
Issue 004 Executive Summary
The PDF cover image is an AI-generated editorial visualization based on the documented event and is not a contemporaneous documentary photograph. The website image for this issue is likewise not a record of observed storm impact.
New York City and the Tri-State Region of New York, New Jersey and Connecticut · September 25–28, 2026
Quiet Rivers, Exposed Waterfronts
From September 25 to 28, 2026, a nor’easter brought steady rain to New York City and the Tri-State Region of New York, New Jersey and Connecticut. A nor’easter is a strong coastal storm with winds from the northeast. True Elements’ TrueQi® Water Intelligence System, supported by Argus™, examined the storm using 12 public map layers. The investigation covered five places: New York City, Newark, Trenton, Long Island and Hartford.
The rain itself was moderate. Estimated rainfall around New York City was about 0.75 to 1.5 inches. During the one observation session, no river gauge and no river forecast that was viewed showed a river nearing or reaching flood stage.
The stronger signal came from maps and models of risk. Areas at high risk from storm surge (seawater pushed onto land by wind) line up with official FEMA flood zones. Those same low-lying harbor, bay and tidal-river areas also have polluted waters and nearby contaminated sites. This overlap is strongest around:
- New York Harbor and Newark Bay
- the Hackensack and Passaic rivers and the Meadowlands
- Newtown Creek
- the South Bronx waterfront
True Elements assessed the event as a compound flood and contamination-risk event. In other words, flooding risk and pollution risk sit in the same places. This is an assessment of exposure, meaning where harm could happen. It does not document harm that did happen. No flooding depth, sewer overflow, pollution release or damage was observed.
Timing is the biggest open question. All readings came from a single session, and their times were not recorded. That session therefore cannot be compared with the storm’s peak.
The investigation used public layers from federal agencies, plus True Elements’ own modeled water-quality score. Each layer is a different kind of evidence:
- Observed layers record what was measured.
- Forecast layers show what is expected.
- Mapped layers show official zones and locations.
- Modeled layers show estimated risk.
Only the observed layers describe what happened during this storm.
| Source | Who provides it | What it tells us |
|---|---|---|
| Rainfall estimate (QPE, “Today” period) | NOAA / National Weather Service | Observed estimate of how much rain fell. It may not cover the full four-day storm. |
| Live stream gauges | U.S. Geological Survey (USGS) | Observed river flow. Every gauge viewed read normal or below normal. |
| River gauges and river flood forecasts | NOAA / National Weather Service | Observed flood category and forecast flood severity. No flooding was shown. |
| Coastal storm surge risk | Agency not identified in the source package | Modeled zones where seawater could push inland. Shows risk, not this storm’s water levels. |
| National Flood Hazard Layer | Federal Emergency Management Agency (FEMA) | Mapped official flood zones. Not the area that actually flooded. |
| Hydrography and 3D hydrography | USGS | Mapped creeks, channels and drainage paths that can carry water inland. |
| ATTAINS impaired waters | U.S. Environmental Protection Agency (EPA) | Mapped waters the EPA lists as impaired, meaning they were already assessed as having water-quality problems. |
| Superfund sites | EPA | Mapped locations of sites on the national list of seriously contaminated land. |
| Groundwater nitrate assessment | USGS | Modeled chance of nitrate in groundwater. Not a storm-specific or drinking-water test. |
| TrueQi® Surface Water Quality Score | True Elements | Modeled water-quality grid. Not a regulatory measurement. |
| New York and New Jersey beach layers | Agency not identified in the source package | No usable data, so recreational-water conditions are unknown. |
Layers read during a single observation session in September 2026; reading times were not captured. Several map legends could not be fully read, so exact color thresholds are unconfirmed.
- Gather. Public layers on rain, rivers, surge, flood zones, water quality and contaminated sites were read for five places in one observation session.
- Sort the evidence. Each layer was labeled as observed, forecast, mapped or modeled, so risk maps are not mistaken for actual flooding.
- Compare. Argus™ helped organize and compare the layers to find where they agree. Here, surge risk, flood zones, polluted waters and contaminated sites overlapped in the same tidal corridors.
- Interpret and flag gaps. True Elements ranked the areas of greatest concern. It also recorded what the evidence cannot show: timing, tide records, sampling results and actual damage. Interpretations remain subject to human expert review.
Viewed one layer at a time, this storm looks ordinary: moderate rain, calm river gauges and no river flood forecast. A reader could easily decide there was nothing to worry about.
Viewed together, the layers tell a different story. Many of the places most exposed to storm surge and flooding are also the places with polluted waters, contaminated land, and dense roads, rail and industry. In those areas, even moderate rain or a small surge could carry pollution into nearby water.
“The region’s greatest risks emerge where flooding and water-quality degradation overlap.”
Connecting trusted sources does not replace tide records, water sampling or field inspection. It shows where those checks would tell us the most, and why.
The evidence shows two things. First, the nor’easter brought moderate rain without river flooding at the gauges that were viewed. Second, the region’s mapped and modeled flood risk is concentrated in harbor, bay and tidal-river corridors whose waters are already degraded.
Based on how strongly the layers overlap, True Elements ranked five areas of concern:
- the Harbor–Newark Bay–Meadowlands system, from Hoboken and Jersey City to Newark and the Ironbound
- Newtown Creek and the Brooklyn–Queens waterfront
- the South Bronx waterfront, especially Port Morris
- Long Island’s tidal corridors
- the Connecticut River corridor, along with the Long Island Sound shoreline, which was not assessed
This ranking reflects mapped and modeled overlap, not observed impact. Trenton’s mapped floodplain still matters for heavier storms.
For responsible agencies, the findings point to useful questions rather than directives:
- whether flood-prone transit, drainage and electrical assets should be inspected
- whether sewer overflows reached impaired waters
- whether contaminated waterfront sites were disturbed
- where direct water sampling would show actual conditions
Public messaging can also explain that “no river flood stage” does not mean “no hazard.” Decisions rest with responsible agencies and qualified professionals.
No flooding depth, sewer overflow, pollution release or damage was observed. The readings came from one session with no recorded times, so it is unknown whether they captured the storm’s peak. Tide records, official rainfall totals, beach data, water sampling and field inspection are needed to establish what actually happened.
The complete evidence, sources and limitations. The full Water Intelligence Event Report for Issue 004 documents every data layer, measurement, qualification and source behind this Summary. Use Request Complete Report on this issue to ask for access. The executive summary PDF is not the complete report.
True Elements is a water intelligence company. Its TrueQi® Water Intelligence System, supported by Argus™, connects trusted public water, weather and hazard data into a traceable operating picture for consequential decisions.
Website: trueelements.com · Start a conversation: trueelements.com/contact
Water Intelligence Event Summary 004 • NYC Tri-State Nor’easter Flood and Water-Quality Event
This report is a water intelligence analysis prepared by True Elements using the TrueQi® Water Intelligence System and Argus™ AI analytics, applying True Elements' proprietary data integration and interpretation methodology, including subject matter covered by U.S. Patent No. US 12,670,407 B2 and pending patent applications. It synthesizes and interprets publicly available third-party data, including applicable NOAA, National Weather Service, FEMA, USGS, state and local sources, as of the stated observation snapshot.
This report does not constitute engineering, hydrological, meteorological, legal, financial, insurance or other professional advice, and is not a substitute for such advice. It is not an emergency warning, official flood forecast or regulatory determination, and must not be relied upon as the sole basis for safety, engineering, financial, insurance, legal or emergency-response decisions. Readers should independently verify all conditions through official NOAA, National Weather Service, USGS, state and local emergency-management sources, and should consult a licensed engineer, hydrologist, attorney or other qualified professional before taking any action in reliance on this report.
True Elements makes no representation or warranty, express or implied, as to the accuracy, completeness, timeliness or fitness for any particular purpose of the information contained in this report, including data obtained from third-party sources. Environmental conditions change rapidly and may have changed materially since the observation snapshot referenced herein. True Elements disclaims all liability for any loss, damage, injury or claim arising from reliance on this report, to the fullest extent permitted by law.
TrueQi® is a registered trademark of True Elements Inc. Argus™ and AgForward™ are trademarks of True Elements Inc. This report and its methodology are proprietary to True Elements and may not be reproduced or redistributed without permission.
Argus™-generated interpretations are analytical outputs of an AI system and are provided for decision-support purposes only; they are not certified engineering conclusions and remain subject to human expert review.
© 2026 True Elements. All rights reserved.
Questions about this report
Answers draw only on the executive summary above, and keep its distinctions between observation, mapped exposure, modeled scenarios, inference and unknowns.
What did the investigation find beyond the moderate rainfall and viewed river gauges?
Estimated rainfall around New York City was about 0.75 to 1.5 inches, and no river gauge or river forecast that was viewed showed a river nearing or reaching flood stage. The stronger signal came from maps and models of risk: areas at high risk from storm surge line up with official FEMA flood zones, and those same low-lying harbor, bay and tidal-river areas also have polluted waters and nearby contaminated sites. True Elements assessed the event as a compound flood and contamination-risk event, meaning flooding risk and pollution risk sit in the same places.
See the executive summaryWhere did mapped flood and contamination risks overlap in the NYC/Tri-State study area?
The overlap is strongest around New York Harbor and Newark Bay, the Hackensack and Passaic rivers and the Meadowlands, Newtown Creek, and the South Bronx waterfront. Three areas with Superfund sites sit in or beside high surge-risk zones: Newtown Creek, Newark’s Ironbound by the Passaic River and Newark Bay, and Port Morris in the South Bronx. The report’s ranking of areas of concern reflects mapped and modeled overlap, not observed impact.
See the executive summaryDid the report confirm flooding, pollution releases, or damage during the nor’easter?
No. This is an assessment of exposure, meaning where harm could happen; it does not document harm that did happen. No flooding depth, sewer overflow, pollution release or damage was observed, so the contaminated waterfront areas are priorities for review and sampling rather than documented releases.
See the executive summaryWhich evidence was observed, and which was a map, forecast, or modeled risk layer?
The NWS rainfall estimate, USGS live stream gauges and NWS river gauges are observed layers, and the NWS river flood forecasts are forecasts. FEMA flood zones, USGS hydrography, EPA impaired waters and Superfund sites are mapped layers, while the coastal storm-surge risk layer, the USGS groundwater nitrate assessment and the TrueQi® Surface Water Quality Score are modeled. Only the observed layers describe what happened during this storm; the surge and flood-zone maps show risk, not where water actually went.
See the executive summaryWhat missing timing records or observations would help test the assessment?
All readings came from a single observation session and their times were not recorded, so that session cannot be compared with the storm’s peak. The report states that tide records, official rainfall totals, beach data, water sampling and field inspection are needed to establish what actually happened. The Long Island Sound coast was not assessed.
See the executive summaryContinue exploring
- Another dated investigation · Issue 005Hurricane Nolo: Where New Storm Exposure Met Existing StressA separate, dated investigation of mapped and modeled coastal exposure across Oʻahu and Hawaiʻi Island during the September 23–30, 2026 analysis period.
- CollectionThe Water Intelligence SeriesEvery dated investigation, newest first, with executive summaries, summary PDFs and complete-report requests.
- PerspectivesInsightsEssays and analysis on how water shapes business decisions, infrastructure, food systems and communities.
- Related applicationGovernment & Infrastructure Water Intelligence